Tag: Tasar silk production Jharkhand

  • “Indian Forest Report 2021”

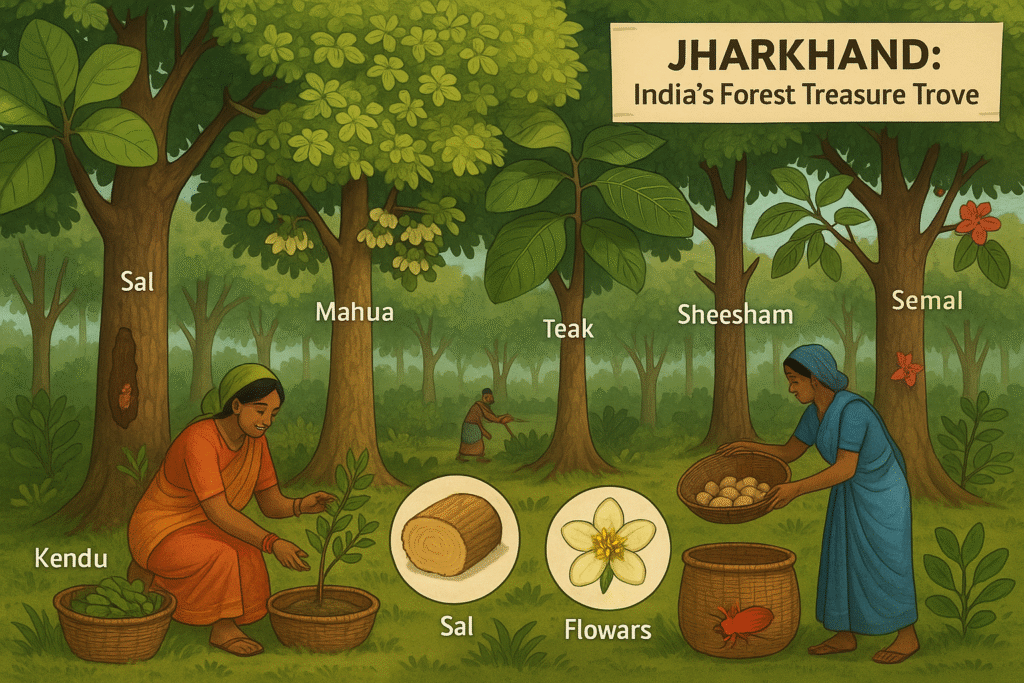
    Jharkhand, often referred to as the “Green Heart of India,” boasts a dense cover of tropical dry deciduous forests that span nearly 29.76% of its geographical area, making it one of India’s richest states in forest biodiversity and forest-based livelihoods. With over 93% of its land covered under dry deciduous zones, the state is home to valuable major forest products like Sal (Sakhua), Mahua, Sheesham, Teak, and Semal, as well as minor forest produce (MFP) including Lac (Lakh), Kendu leaves, and Tasar silk. These resources not only support tribal and rural economies, but also play a crucial role in India’s timber, herbal, and silk industries. Jharkhand leads the country in Lac production (57%) and Tasar silk production (76.4%), and has implemented sustainable forest management policies through cooperatives like JHAMFCOFED, empowering forest-dependent communities. This blog explores the rich natural wealth of Jharkhand’s forests, their economic significance, ecological benefits, and role in employment generation, with a focus on facts often asked in competitive exams and government assessments.

    Total Forest Area in Jharkhand

    • As per ISFR-2021, forests cover 23,721.14 sq. km, which is 29.76% of Jharkhand’s total geographical area.
    • Jharkhand contributes 3.31% to India’s total forest area.
    • National Ranking (by percentage of forest cover): 10th position among all states.
    • Per capita forest and tree cover in the state is 0.08 hectares (as per ISFR-2021).

    Note: Jharkhand’s forest cover is higher than the national average (21.67%) but lower than the National Forest Policy target of 33%.

    Growth in Forest Area

    • Between 2019 and 2021, Jharkhand recorded a forest cover increase of 109.73 sq. km (0.46%).
    • In terms of forest area growth, Jharkhand ranks 5th among all Indian states.

    Classification of Forest Cover (Area in sq. km)

    Forest Type20132015201720192021% Share (2021)
    Very Dense Forest2,5872,5882,5982,603.202,601.053.36%
    Moderately Dense9,6679,6639,6869,687.369,688.9112.16%
    Open Forest11,21911,22711,26911,320.8511,431.1814.34%
    Total23,47323,47823,55323,611.4123,721.1429.76%

    Note: Open forests make up the largest share (48%), followed by moderately dense (41%) and very dense forests (11%).

    District-wise Forest Area

    Districts with Highest Forest Area (in sq. km):

    1. West Singhbhum3,368
    2. Latehar2,403
    3. Chatra1,782

    Districts with Lowest Forest Area (in sq. km):

    1. Jamtara106
    2. Deoghar206
    3. Dhanbad218

    District-wise Forest Area Percentage (to Total Area)

    Districts with Highest Forest Percentage:

    1. Latehar56.0%
    2. Chatra47.9%
    3. West Singhbhum46.6%

    Districts with Lowest Forest Percentage:

    1. Jamtara5.8%
    2. Deoghar8.3%
    3. Dhanbad10.7%

    Tribal Districts and Forests

    • Jharkhand has 17 identified tribal districts (out of 218 in India), placing it at 3rd rank after Madhya Pradesh (24) and Assam (19).
    • These tribal districts are:
      Deoghar, Dumka, Godda, Jamtara, Sahibganj, Pakur, Palamu, Garhwa, Latehar, Lohardaga, Khunti, Ranchi, Gumla, Simdega, Seraikela-Kharsawan, East Singhbhum, West Singhbhum.

    Key Stats:

    • Total Area of 17 tribal districts: 58,677 sq. km
    • Forest Area: 17,521 sq. km
    • Forest Cover in tribal districts: 29.86%

    Forest Cover in Tribal Districts (Area in sq. km, ISFR-2021)

    Forest Type20192021% Share (2021)
    Very Dense Forest1,8791,87710.7%
    Moderately Dense7,2497,25041.3%
    Open Forest8,3138,33448.0%
    Total17,44117,521100%

    Increase of 80 sq. km in forest area in tribal districts between 2019 and 2021.

    Jharkhand Forest Policy Highlights

    To achieve the 33% forest cover goal, Jharkhand Government has implemented a state-level forest policy with key features:

    • Formation of Forest Committees in every village – each family must have one member.
    • Tree plantation according to the needs of rural communities.
    • Procurement of forest produce through government agencies.
    • Joint forest protection responsibility shared between villagers and forest department.
    • Over 10,000 forest committees have been formed under this policy.

    Classification of Recorded Forests in Jharkhand

    1. Protected Forests (PF)

    • Forests where limited human activity is allowed with restrictions.
    • Area: 18,922 sq. km75.35% of total forest area.
    • District with largest PF area: Hazaribagh, followed by Garhwa, Palamu, and Ranchi.

    2. Reserved Forests (RF)

    • Completely restricted forests – no grazing or cutting permitted.
    • Area: 4,500 sq. km17.90% of total forest area.
    • Largest Reserved Forest Zones: Porahat and Kolhan, along with Rajmahal and Palamu forests.

    3. Unclassed Forests (UF)

    • Forests that don’t fall under Reserved or Protected categories.
    • Area: 1,696 sq. km6.75% of total forest area.
    • Largest UF Area: Sahibganj, followed by West Singhbhum and Dumka.

    Important Facts for Competitive Exams

    • Jharkhand’s forest cover is 29.76% (ISFR 2021).
    • Ranks 10th in India by forest cover percentage.
    • Ranks 5th in India in terms of forest area increase.
    • Per capita forest cover: 0.08 ha.
    • Very Dense Forest share: 3.36%.
    • Open Forests have the highest share: 14.34%.
    • West Singhbhum – Highest forest area; Jamtara – Lowest.
    • Latehar – Highest forest %; Jamtara – Lowest.
    • Tribal districts forest cover: 29.86%.
    • State Forest Policy aims for 33% cover, community-based approach.

    Overview of Forest Cover in Jharkhand

    • According to the Forest Survey of India (FSI) Report 2021, forests in Jharkhand cover 23,721.14 sq. km, which is 29.76% of the state’s total geographical area.
    • Jharkhand accounts for 3.31% of India’s total forest area.
    • Ranked 10th among Indian states in terms of percentage forest cover.
    • Per capita forest and tree cover in Jharkhand is 0.08 hectare.
    • Jharkhand’s forest cover is higher than the national average (21.67%) but lower than the National Forest Policy target (33%).

    Recorded Forest Area (RFA) in Jharkhand

    • Total recorded forest area: 25,118 sq. km
    • Increase of 110 sq. km in forest area between 2019 and 2021.
    • Jharkhand ranks 5th in India in terms of increase in forest area in the last two years.

    Forest Cover Classification (Area in sq. km)

    Type of Forest20192021% of State Area
    Very Dense Forest (VDF)2,603.202,601.053.36%
    Moderately Dense Forest (MDF)9,687.369,688.9112.16%
    Open Forest (OF)11,320.8511,431.1814.34%
    Total Forest Cover23,611.4123,721.1429.76%

    Forest Composition (2021)

    • Very Dense Forests (VDF): 11%
    • Moderately Dense Forests (MDF): 41%
    • Open Forests (OF): 48%

    Top and Bottom Districts by Forest Area (2021)

    Top 3 Districts by Forest Area

    1. West Singhbhum – 3,368 sq. km
    2. Latehar – 2,403 sq. km
    3. Chatra – 1,782 sq. km

    Bottom 3 Districts by Forest Area

    1. Jamtara – 106 sq. km
    2. Deoghar – 206 sq. km
    3. Dhanbad – 218 sq. km

    Districts with Highest % Forest Cover

    1. Latehar – 56.0%
    2. Chatra – 47.9%
    3. West Singhbhum – 46.6%

    Districts with Lowest % Forest Cover

    1. Jamtara – 5.8%
    2. Deoghar – 8.3%
    3. Dhanbad – 10.7%

    Forest Cover in Tribal Districts

    • Jharkhand has 17 Tribal Districts (Ranked 3rd in India, after MP and Assam).
    • Total area of tribal districts: 58,677 sq. km
    • Total forest area in tribal districts: 17,521 sq. km
    • Forest cover in tribal districts: 29.86% of their geographical area.
    • Increase of 80 sq. km in forest cover from 2019 to 2021 in these districts.

    Recorded Forest Categories in Jharkhand

    CategoryArea (sq. km)% of RFA
    Protected Forests18,92275.35%
    Reserved Forests4,50017.90%
    Unclassed Forests1,6966.75%

    Protected Forests

    • Human activities like grazing or cutting are allowed with restrictions.
    • Largest protected forest area: Hazaribagh
    • Others: Garhwa, Palamu, Ranchi

    Reserved Forests

    • Strictly protected: No human activity allowed without permission.
    • Largest areas: Porahat, Kolhan, Rajmahal, Palamu forests.

    Unclassed Forests

    • Forests not under reserved/protected category.
    • Largest unclassed forest area: Sahibganj, followed by West Singhbhum, Dumka, Hazaribagh.

    Forest Cover Within & Outside RFA (2021)

    Within Recorded Forest Area:

    • Very Dense Forest: 1,414 sq. km (11.51%)
    • Moderately Dense Forest: 5,186 sq. km (42.23%)
    • Open Forest: 5,682 sq. km (46.26%)
    • Total: 12,282 sq. km

    Outside Recorded Forest Area:

    • Very Dense Forest: 1,187 sq. km (10.37%)
    • Moderately Dense Forest: 4,503 sq. km (39.37%)
    • Open Forest: 5,749 sq. km (50.26%)
    • Total: 11,439 sq. km

    Tree Cover & Forest-Tree Statistics

    • Total Forest Cover (2021): 23,721.14 sq. km
    • Tree Cover: 2,657 sq. km
    • Total Forest + Tree Cover: 26,268 sq. km
    • % of Geographical Area: 33.35%
    • Per Capita Forest & Tree Cover: 0.08 hectare

    Land Use Pattern in Jharkhand (2021)

    Land UseArea (‘000 ha)% of Reporting Area
    Forest2,23928.09%
    Not Available for Cultivation1,28116.07%
    Permanent Pastures & Grazing1271.59%
    Misc. Tree Crops & Groves1211.52%
    Culturable Waste3684.62%
    Fallow Other Than Current1,10513.86%
    Current Fallow1,28516.13%
    Net Sown Area1,44418.12%

    Forest Types Based on Climate

    Tropical Moist Deciduous Forests

    • Found in areas with rainfall >120 cm
    • Common in Singhbhum, southern Ranchi, southern Latehar, Santhal Pargana
    • Dominant species: Sal, Shisham, Jamun, Palash, Semal, Mahua, Bamboo
    • Sal is considered the king of deciduous forests.
    • Covers 2.66% of state area

    Tropical Dry Deciduous Forests

    • Found in areas with rainfall <120 cm
    • Spread in Palamu, Giridih, Singhbhum, Hazaribagh, Dhanbad, Santhal Pargana
    • Dominated by grasses and shrubs, trees include Bamboo, Neem, Peepal, Khair, Palash, Jackfruit, etc.

    Forest Policy Initiatives in Jharkhand

    • Target: Increase forest cover beyond 33%
    • Formation of over 10,000 Village Forest Committees
    • Each village has one forest committee, including one member per household.
    • Emphasis on:
      • Plantation based on villagers’ needs.
      • Procurement of forest products via government agencies.
      • Shared responsibility of forest protection between villagers and forest department.

    Forest Types in Jharkhand

    • Tropical Dry Deciduous Forests dominate 93.25% of the state’s area.
    • Two main types of forests:
      • Moist Deciduous Forests
      • Dry Deciduous Forests

    Major Forest Products of Jharkhand

    1. Sal (Shorea robusta / Sakhua)

    • State Tree of Jharkhand.
    • Extremely hard and durable, used in:
      • Construction timber
      • Furniture
      • Railway sleepers and coach flooring
    • Flowers known as Sarai Phool
    • Seeds yield Kujri oil, used in natural medicine

    2. Shisham (Siscoo / Dalbergia sissoo)

    • Known for strong and durable wood
    • Widely used in furniture making

    3. Mahua (Madhuca indica)

    • Considered the most useful tree in Jharkhand
    • All parts used: wood, fruit, flowers, seeds
    • Uses:
      • Wood for doors and posts
      • Flowers as food
      • Seeds for extracting oil

    4. Teak (Tectona grandis / Sagwan)

    • Hard and beautiful wood
    • Used in furniture and railway coaches

    5. Semal (Silk Cotton Tree)

    • Light, soft, and white wood
    • Used in:
      • Packaging boxes
      • Planks and toys
    • Produces cotton-like fiber

    6. Gamhar (Gmelina arborea)

    • Wood is light, smooth, durable
    • Suitable for furniture and carving

    7. Jamun (Syzygium cumini)

    • Resistant to water, used in:
      • Well bases
      • Furniture
    • Seeds used for medicines, fruits are edible

    8. Mango (Mangifera indica)

    • Easily available, wood used for doors and furniture

    9. Jackfruit (Artocarpus heterophyllus)

    • Wood used in building construction
    • Fruit is edible

    10. Kendu (Diospyros melanoxylon)

    • Wood: Used as a primary forest product
    • Leaves: Collected as minor forest produce for beedi production

    Minor Forest Products of Jharkhand

    A. Lac (Lakh) Production

    • Jharkhand contributes 57% of India’s total lac production
    • Leading lac-producing state
    • Favorable conditions:
      • Elevation: ~350m above sea level
      • Temperature: 24–26°C
      • Rainfall: <150 cm
    • Types of Lac:
      • Aghani Lac – 47% ★
      • Jethwi Lac – 44%
      • Baisakhi Lac – 6%
      • Katki Lac – 3%
    • Lac insect (Laccifer lacca) grown on:
      • Palash
      • Kusum
      • Ber trees
    • Insoluble in alcohol, non-conductor of electricity
    • Uses:
      • Polish, varnish, bangles, gramophone records, toys, fireworks
    • Top producing districts (latest data):
      • Ranchi ★ (1st)
      • Simdega (2nd)
      • Gumla (3rd)
      • Previously, Khunti was the leader
    • Torri (Latehar district): Important lac export hub
    • Government initiatives:
      • Formation of 1,750 Forest Management Committees (2014–15)
      • Lac given the status of Agriculture by the Jharkhand Government ★

    ✴ Historical & Institutional Highlights

    • Indian Lac Research Institute established on 20 Sept 1924 in Namkum, Ranchi
    • Later renamed:
      • Indian Institute of Natural Resins and Gums (2007)
      • National Institute of Secondary Agriculture (NISA) – current name
    • ‘Lac’ originates from Sanskrit word ‘Laksha’

    JHAMFCOFED (झाम्पकोफेड)

    • Full Name: Jharkhand State Minor Forest Produce Co-operative Development and Marketing Federation Limited
    • Established in 2007
    • Objective:
      • Protect forest dwellers from middlemen
      • Promote minor forest produce-based industries through cooperatives
    • Two-tier structure
      • Head body and 88 Primary Cooperative Societies

    B. Kendu Leaves (Tendu Patta)

    • Most important minor forest product for revenue
    • Used for beedi and tobacco wrapping
    • Governed by:
      • Jharkhand Kendu Leaf Policy, 2015
    • Policy ensures:
      • Fair wages for primary collectors

    C. Tasar Silk (Wild Silk)

    • Jharkhand ranks 1st in India for tasar silk production
    • Contributes 76.4% of India’s tasar output
    • Silkworms reared on:
      • Sal, Arjun, and Asan trees
    • India produces four silk types:
      • Mulberry
      • Eri
      • Muga
      • Tasar – most prominently from Jharkhand

    Key Highlights for Exams

    • Sal is the State Tree of Jharkhand
    • Jharkhand is India’s top producer of Lac and Tasar Silk
    • Lac industry centered in Ranchi, Simdega, Gumla
    • Lac Institute in Namkum established in 1924
    • JHAMFCOFED works for fair trade of forest produce
    • Kendu Leaf and Tasar are major minor products
    • Lac renamed as Agricultural product by the State
  • Economic Condition and Geography of Jharkhand: A Detailed Overview

    Jharkhand, a mineral-rich state carved out of Bihar in 2000, presents a paradox of immense natural wealth alongside stark economic underdevelopment. The state’s economy can be analyzed under four major categories:

    1. Economic Features

    Semi-Developed Natural Resources

    • Jharkhand has abundant but underutilized or semi-utilized natural resources.
    • A significant portion of land remains barren or uncultivable.
    • Only 28.8% of the total geographical area (79,49,929.9 hectares) is under net sown land.
    • Around 30.22% of land is still classified as fallow, barren, or unproductive.
    • Despite having mineral wealth and water resources, their exploitation is limited due to institutional bottlenecks, flawed policies, and social structures.
    • Imbalance in the manufacturing sector hampers industrial development.
    • Jharkhand’s contribution to India’s Gross Domestic Product (GDP) rose slightly from 1.6% in 2000 to 1.84% in 2015-16, and then dropped to 1.61% in 2018-19.

    Heavy Dependence on Agriculture

    • Agriculture remains the primary occupation of 70% to 85% of the population.
    • The economy is heavily reliant on the primary sector.
    • Dependence on agriculture stems from lack of opportunities in other sectors.
    • This leads to:
      • Fragmented landholdings.
      • Hidden/unutilized agricultural labor.
      • Lack of modern agricultural techniques and poor organizational efficiency.
    • As a result, agricultural productivity is low, per capita income is meager, and most farmers live at subsistence levels.
    • Agricultural contribution to the Gross State Domestic Product (GSDP):
      • 14.97% in 2016–17,
      • 15% in 2017–18,
      • 22% in 2022–23.

    Shortage of Capital

    • Jharkhand faces a dual capital deficiency:
      • Low per capita capital availability.
      • Poor capital formation rate.
    • Inadequate exploitation of resources hampers creation of capital goods.
    • Savings are minimal due to low income-consumption differential.
    • As per 2011 census, the population is 3.29 crore with only 10 banks per 1,00,000 people (as of 2020-21).
    • In 2018, agricultural loans formed only 15.55% of total bank loans, showing a decline from 15.82% in 2017.
    • Non-Performing Assets (NPAs) in Jharkhand’s banks were 5.87% of total loans.

    Declining Industrialization

    • The state lacks large-scale, modern industries.
    • Only a small fraction of the population is employed in industrial activities.
    • Existing industrial units are concentrated in specific zones without widespread impact.
    • Industry’s contribution to GSDP:
      • 41.9% in 2011–12,
      • Dropped to 34.93% in 2018–19,
      • Further reduced to 33.6% in 2021–22.
    • The tertiary sector contributed 44.1% to the overall output.

    Low Per Capita Income and Poor Living Standards

    • Being a semi-developed economy, per capita income is low.
    • Most people suffer from poverty, illiteracy, malnutrition, and disease.
    • Around 70% of families lack access to government healthcare facilities.
    • Among poor families, less than 16% benefit from health services.
    • Per capita income:
      • ₹10,129 in 2001–02,
      • ₹76,806 in 2018–19,
      • ₹51,365 in 2020–21 (based on 2011–12 base year).
    • National average was ₹1,12,835 in 2020–21.
    • Jharkhand ranked 26th among Indian states in per capita income, just above Assam, Manipur, Uttar Pradesh, and Bihar.

    Economic Inequality

    • Wealth and income are unevenly distributed in the state.
    • A small section controls a large share of income, while the majority survives on minimal resources.
    • The disparity is more pronounced in rural areas than urban centers.
    • Wealthy classes enjoy greater saving and investing capacity, maintaining a continuous income flow.
    • Meanwhile, the poor remain excluded due to the absence of effective redistributive mechanisms.

    Unemployment and Disguised Unemployment

    • Jharkhand suffers from widespread unemployment and underemployment.
    • Unemployment rate in 2018–19:
      • National average: 3.6%,
      • Jharkhand: 7.7%.
    • Primary reasons include:
      • Lack of capital,
      • Absence of complementary development infrastructure,
      • High hidden unemployment in agriculture and traditional industries.

    Vicious Cycle of Poverty

    • Jharkhand’s economy is trapped in a vicious cycle of poverty:
      • Poverty leads to low income,
      • Low income leads to poor nutrition,
      • Poor nutrition reduces work capacity,
      • Reduced work capacity further lowers income.
    • Breaking this cycle requires strategic development of production resources.

    Banking and Financial Institutions

    • Banking facilities in Jharkhand remain limited.
    • As of the latest available data:
      • Number of bank branches: 3,008
      • Number of ATMs: 3,473
    • In 2020-21, there were 3,203 bank branches and 3,262 ATMs (as of June 30, 2020).
    • Less than 1% of the state’s ATMs are located in Simdega, Lohardaga, Latehar, and Khunti districts.
    • 10-20% of the ATMs are concentrated in Dhanbad and East Singhbhum.
    • The ratio of branch to currency is significantly low, indicating poor financial penetration.
    • Financial institutions are often reluctant to issue loans, leading to a sluggish pace in economic activities.

    Population-Related Challenges

    (i) High Birth and Death Rates

    • The state experiences relatively higher birth and death rates, mainly due to underdeveloped rural areas.
    • In 2015, the birth rate was 23.5 per thousand, and in 2016, the infant mortality rate was 29.
    • As of 2020:
      • Birth rate: 16.66
      • Death rate: 3.06
      • Ranchi had the highest district-wise death rate: 5.52

    (ii) Rapid Population Growth

    • Decadal population growth rate (2001–2011): 22.34%
      • Much higher than the national average of 17.70%
    • Urban areas are growing faster than rural areas.
    • Districts with higher-than-average growth rates: Koderma, Latehar, Chatra, Giridih, Pakur, and Deoghar.
    • Districts with lower growth than the state average: Dhanbad (11.91%), Ramgarh (13.06%), East Singhbhum (15.53%), Bokaro (15.99%), Simdega (16.62%), Dumka (19.39%)

    (iii) Predominantly Rural Population

    • Total population: 32,966,268
    • Rural population: ~76%
    • Urban population: ~24%
    • The rural-urban divide significantly impacts the state’s economic structure, reflecting a semi-developed economy reliant on agriculture and primary sectors.

    (iv) Heavy Burden of Dependents

    • Estimated 16% of the population is below 5 years of age.
    • 15–59 age group accounts for around 99.9% of the working-age population, yet a large portion of income goes toward consumption rather than investment.
    • Rising percentage of the elderly (60+), while children’s population is decreasing due to better birth control measures.
    • A large dependent population adds pressure on the productive section of society.

    (v) Nutritional Deficiency

    • A significant portion of the population suffers from a lack of nutrition, affecting physical strength and productivity.
    • The government has implemented the Integrated Child Development Services (ICDS) to combat malnutrition.

    Social, Cultural, Political, and Administrative Aspects

    (i) Low Literacy Rate

    • Literacy rate: 54.13%, significantly below the national average of 64.2%
      • In contrast:
        • Chhattisgarh: 65.2%
        • Uttarakhand: 72.3%
    • Female literacy: Only 39.38%
    • High illiteracy leads to ignorance, superstition, and limited participation in developmental initiatives.
    • Women are particularly disadvantaged, both educationally and socially.

    (ii) Lack of Social Motivation and Outlook

    • Social backwardness and orthodox mentality impede progress.
    • Lack of motivation discourages the flow of labor and capital.
    • Persistent poverty has fostered a sense of fatalism, leading to loss of willpower to improve conditions.
    • This mindset must be addressed to promote economic development.

    (iii) Law and Order

    • As per the National Crime Records Bureau (2021):
      • Jharkhand recorded 1,792 cases of violent and cognizable crimes, including abduction—less than Bihar (10,252), Maharashtra (10,680), and Uttar Pradesh (14,714).
      • Murder cases: 1,606 (1,594 adults)
    • Crime reflects administrative weakness and affects economic activities and investments.

    Technical and Infrastructural Challenges

    (i) Lack of Technical Knowledge

    • Jharkhand follows traditional methods in most sectors due to limited access to modern technical know-how.
    • Low per-worker productivity and high economic costs result from lack of technical training.
    • While modern technologies have reached some areas, most sectors remain untouched.
    • High prevalence of unskilled and illiterate labor with a shortage of skilled workers.

    (ii) Inadequate Transportation and Communication

    • Infrastructure for transportation and communication is underdeveloped.
    • Hinders smooth economic development and access to markets and services.
    • The state lacks large-scale economic structures required for industrial and service sector expansion.

    Agricultural and Industrial Growth

    • Agriculture remains the backbone of Jharkhand’s economy.
    • Rice production:
      • 2014-15: 2,007,881 metric tons
      • 2019-20: 3,402,173 metric tons
    • Wheat production:
      • 2014-15: 93,253 metric tons
      • 2019-20: 186,903 metric tons
    • Between 2004–05 and 2017–18:
      • Rice increased from 1,677 to 5,109 thousand tons.
      • Wheat rose from 150 to 470 thousand tons.
      • Food grain production grew by 37%.
      • Pulse production increased by 33.6%.
    • Improved irrigation, high-yield seeds, and scientific farming methods have led to rising productivity.
    • Industrial progress, especially in basic industries, has begun contributing to economic and social capital.

    Signs of Emerging Development

    • There are visible indicators of development, though not yet extensive or rapid.
    • Per capita income has increased by about 5%.
    • Savings and investment rates are rising, with investment reaching 25.9%.
    • Despite this progress, current capital formation and investment levels remain insufficient.
    • Many structural impediments are gradually weakening, opening the way for accelerated development.

    Land, Soil, Irrigation, and Agriculture in Jharkhand: Challenges and Progress

    Jharkhand, with its diverse geography and climate, is rich in agricultural potential. However, factors such as acidic soil, rugged terrain, and limited irrigation have posed significant challenges. Below is a detailed overview of the state’s land use, soil classification, irrigation, and agricultural production:

    Soil and Land-Related Agricultural Challenges

    • Acidic soil and uneven terrain are major obstacles to agricultural development.
    • Forest cover in the state is 29.76% (as of 2021), limiting the availability of cultivable land.
    • About 72% of Jharkhand’s land is rocky, plateau-like, and barren, making it unsuitable for cultivation.
    • Deforestation leads to soil erosion, further increasing barren land.
    • Out of Jharkhand’s 79,714 sq. km:
      • 23.22 lakh hectares are forests
      • 5.66 lakh hectares are barren
      • 7.24 lakh hectares are usable for agriculture and non-agricultural purposes
      • 0.9 lakh hectares are used as pastures

    Land Use Patterns in Jharkhand (in %)

    Land Use TypePercentage
    Net sown area18.12%
    Current fallow land16.13%
    Forest land28.09%
    Other fallow land13.86%
    Land unavailable for cultivation16.07%
    Non-agricultural use8.6%
    Barren land4.62%
    Grazing land1.59%
    Tree-covered area1.52%
    Cultivable waste land3.44%
    • Key issue: Even where cultivable land exists, the lack of irrigation facilities hinders productivity.
    • Most agriculture is rain-dependent, and uneven rainfall distribution negatively impacts yields.
    • Only 8% of Kharif and 6% of Rabi crops are cultivated on irrigated land. The rest depend entirely on natural rainfall.

    Soil Classification by Farmers in Jharkhand

    Farmers classify soil fertility into six categories based on terrain and properties:

    1. Tand-I (Upper land)
    2. Tand-II
    3. Tand-III
    4. Don-III (Medium land)
    5. Don-II
    6. Don (Lower land)
    • Upper land (Tand):
      • Soil: Red to reddish-brown
      • Properties: Well-drained, acidic, low in organic carbon, nitrogen, calcium, magnesium, and sulfur
    • Medium land (Don):
      • Soil: Yellowish-red
      • Properties: Moderately acidic, contains nitrogen, calcium, magnesium, and sulfur
    • Lower land:
      • Soil: Dull, heavy texture, poorly drained
      • Properties: Slightly alkaline, moderate organic carbon, neutral acidity, nitrogen-rich

    Soil Erosion in Jharkhand

    • Approximately 23 lakh hectares of land suffer serious erosion annually due to undulating terrain and light soil texture.
    • Mild to severe erosion affects around 30 lakh hectares (40%) of land.
    • Surface soil is often lost, reducing fertility.
    • Overuse of nitrogenous fertilizers further worsens erosion problems and must be addressed.

    Acidic Soil Impact

    • Around 16 lakh hectares (19%) of land are highly acidic.
    • Crops such as pulses, oilseeds, maize, wheat, and vegetables are adversely affected.
    • District-wise acidity levels:
      • 25%: Ranchi, Gumla, Lohardaga
      • 22%: East Singhbhum, West Singhbhum, Seraikela, Dumka, Deoghar, Jamtara, Godda, Sahebganj
      • 18%: Hazaribagh, Giridih
      • 11%: Palamu, Garhwa, Latehar

    Main Crops Based on Soil and Climate

    • Food Grains: Rice, wheat, barley, maize
    • Pulses: Lentils, gram, arhar (pigeon pea), khesari, peas
    • Cash Crops: Sugarcane, vegetables

    Crop Seasons

    • Jharkhand grows crops in two major seasons: Kharif and Rabi.

    Rice Cultivation

    • Main food crop of the state, grown in both Aghani (winter) and Garama (summer, irrigated) seasons.
    • Highly productive districts: Ranchi, Dumka, and Singhbhum
    • Rice is cultivated over 15 lakh hectares.
    • Production comparison:
      • 2014–15: 20,07,881 metric tons
      • 2019–20: 34,02,173 metric tons (over 1.5 times increase)

    Irrigation in Jharkhand

    • Irrigation facilities remain inadequate.
    • Graph data shows increasing trends in net irrigated area over the years:
    YearNet Irrigated Area (in ‘000 ha)Net Sown Area (in ‘000 ha)% Irrigated
    2010-11210138415.2%
    2011-12217140615.4%
    2012-13207138514.9%
    2013-14125108511.5%
    2014-15153125012.2%

    Wheat Cultivation

    • Wheat is the fourth major crop in Jharkhand.
    • Highest production: Palamu district (25% of state’s wheat output)
    • Other major districts: Hazaribagh, Godda, Deoghar, Giridih
    • 2019–20 total wheat production: 1,86,903 metric tons

    Maize (Corn) Cultivation

    • Second most important crop after rice.
    • Major production districts:
      • Dumka (highest)
      • Followed by Hazaribagh, Giridih, Singhbhum, Ranchi, Deoghar, and Palamu
    • 2019–20 maize production: 2,35,573 metric tons

    Gram (Chickpea) Cultivation

    • Major districts: Palamu, Godda, Gumla, Hazaribagh, Sahebganj
    • Soil requirement: Clay-loam or sandy-loam, aerated and light-textured
    • 2019–20 gram production: 27,970 metric tons

    Vegetable Farming in Jharkhand

    • Average annual rainfall: 1400 mm
    • Cool and tropical plateau climate makes the region ideal for early vegetable production.
    • Monsoon arrives early (June), providing favorable weather for vegetables.
    • Area under vegetable cultivation: 2.89 lakh hectares
    • Major vegetables: Potato, peas, radish, carrot, tomato, French beans
    • Major districts: Ranchi, Hazaribagh, Dumka

    Vegetable Production and Export

    • Total vegetable production: 34.75 lakh metric tons
    • Exported to: Odisha, West Bengal, Madhya Pradesh, and Uttar Pradesh
    • Production trend is increasing, especially for:
      • Brinjal, cauliflower, onion, peas, potato, tomato
    • 2021–22 Estimated Production: 38.18 lakh metric tons
      • 1st: Potato – 4.29 lakh MT
      • 2nd: Tomato – 4.29 lakh MT
      • 3rd: Cabbage – 3.20 lakh MT
    • Some years see slight production drops.
    • Per capita vegetable requirement: 280 grams/day
      • Jharkhand’s current production: 246 grams/day
      • National average: 230 grams/day
    • Conclusion: Jharkhand surpasses the national average in vegetable output, but still meets only 80% of its internal demand. The remaining 20% gap needs to be addressed.

    Forests, Wildlife, and Environmental Conservation in Jharkhand

    Jharkhand is one of India’s most resource-rich and environmentally significant states. With a diverse forest cover, rich biodiversity, and a wide range of conservation initiatives, the state plays a vital role in India’s environmental sustainability and development planning. Below is a detailed look at Jharkhand’s forest policy, forest types, biodiversity, protected areas, and conservation bodies.

    National Forest Policy and Its Implementation

    • India has had a formal forest policy since 1894, revised in 1952 and again in 1988.
    • The 1988 National Forest Policy focuses on the protection, conservation, and development of forests.
    • Key objectives of the 1988 policy include:
      • Ensuring environmental stability through ecological balance.
      • Conserving natural resources, forests, and reforestation.
      • Controlling soil erosion and forest degradation in river catchment areas.
      • Preventing expansion of sand dunes in desert and coastal areas.
      • Promoting mass afforestation and social forestry.
      • Meeting the needs of rural and tribal communities for fuelwood, fodder, and minor forest produce.
      • Enhancing forest production to meet national demands.
      • Encouraging the optimal use of forest products and finding alternatives to wood.
      • Promoting people’s participation, especially women, in conservation efforts.

    Forest Cover in Jharkhand (as per Indian Forest Survey, 2021)

    Forest TypeArea (sq km)Percentage
    Very Dense Forest (70%+ cover)2601.053.26%
    Moderately Dense Forest9688.9112.16%
    Open Forest11,431.1814.34%
    Scrub Forest584.200.73%

    Major Tree and Plant Species in Jharkhand

    • Dominant species: Sal.
    • Other species include: Asan, Gamhar, Bija Sal, Karam, Salai, Khair, Dhawra, Semal, Bamboo, Mahua, Karanj, Palash, Kusum, Ber, Amaltas, and Kend.
    • Shrubs and grasses: Include species like Putush and Sawai grass.

    Legal Provisions and Forest Conservation

    • The Forest Conservation Act, 1980 is implemented in Jharkhand.
    • Central government approval is required before converting forest land for non-forest purposes.
    • State-level Principal Conservators of Forests can approve up to 5 hectares of land conversion (excluding illegal encroachments and mining).
    • Forest Act provisions are not applicable for survey works like transmission lines, hydropower projects, seismic surveys, and oil exploration.
    • A 100% centrally sponsored scheme is being implemented to rejuvenate degraded forests in tribal-dominated areas by involving local communities.
    • This scheme is named “Regeneration of Degraded Forests on a usufruct basis by Tribal and Rural Poor”, aiming to provide employment and forest-use rights to tribal people.

    Wildlife in Jharkhand

    • Forests of Jharkhand host a wide range of wildlife, including:
      • Mammals: Sloth bear, langurs, monkeys, wild dogs, cheetals, sambars, nilgai, wild boars, elephants, tigers, leopards, bison, wolves, hyenas.
      • Birds, reptiles, amphibians, and insects are also abundant.

    Wildlife Sanctuaries and Protected Areas

    1. National Park:
      • Betla National Park (Palamu) – Established in 1986.
    2. Wildlife Sanctuaries:
      • Palamu Tiger Reserve (1973) – 1129.93 sq. km.
      • Hazaribagh Wildlife Sanctuary (1976) – 186.25 sq. km.
      • Mahuadand Wolf Sanctuary, Palamu (1976) – 63.25 sq. km.
      • Dalma Wildlife Sanctuary, East Singhbhum (1976) – 193.22 sq. km.
      • Topchanchi Wildlife Sanctuary, Dhanbad (1978) – 12.82 sq. km.
      • Lawalong Wildlife Sanctuary, Chatra (1978) – 211.03 sq. km.
      • Koderma Wildlife Sanctuary, Hazaribagh/Gaya (1985) – 177.35 sq. km.
      • Parasnath Wildlife Sanctuary, Giridih (1984) – 39.33 sq. km.
      • Palakot Wildlife Sanctuary, Gumla (1990) – 183.18 sq. km.
      • Udhwa Bird Sanctuary, Sahebganj (1991)
    3. Special Conservation Zones:
      • Singhbhum Elephant Reserve – 23,440 sq. km.
      • Rajmahal Fossil Sanctuary – 5.65 sq. km.
      • Vulture Breeding Center, Ormanjhi
      • Crocodile Breeding Center, Muta (Ormanjhi)
      • Birsa Deer Park, Kalamati (Khunti)
    4. Biological Park:
      • Bhagwan Birsa Biological Park, Ormanjhi (2001) – 6.65 sq. km.

    Wildlife Census (2002 Data)

    • Tigers: 34
    • Leopards: 164
    • Elephants: 758
    • Barking Deer: 3,672
    • Cheetals: 16,384
    • Chousingha: 62
    • Gaur (Bison): 256
    • Nilgai: 1,262
    • Sambar: 3,052
    • Sloth Bear: 1,808
    • Wild Boar: 18,550

    Jharkhand’s Mineral Wealth

    • The state holds a significant portion of India’s mineral resources:
      • Coal: 27.3%
      • Copper: 18.5%
      • Iron Ore: 26%
      • Overall, Jharkhand holds about 40% of India’s mineral reserves.
    • Minor mineral production (sand, gravel, morrum) in 2022–23: 32.72 lakh metric tonnes.
    • Top districts in mineral royalty:
      • 1st: West Singhbhum – ₹1865.96 crore
      • 2nd: Dhanbad – ₹871.18 crore
      • 3rd: Ramgarh – ₹277.18 crore

    Environmental Institutions in Jharkhand

    Central Zoo Authority

    • Monitors the functioning of over 200 zoos across India.
    • Coordinates scientific exchange and animal welfare among zoos.
    • Provides guidance and supervision on national policies for zoos.

    Jharkhand Zoo Authority

    • Formed in 2009; limited to Bhagwan Birsa Biological Park.
    • Main goals:
      • Breeding and protection of endangered species.
      • Rehabilitation of injured, stray, or circus-rescued animals.

    Jharkhand Biodiversity Board

    • Formed in 2007 under the Biodiversity Act, 2002 (Section 22).
    • Key objectives:
      • Conservation and sustainable use of biodiversity.
      • Fair and equitable benefit-sharing.
      • Regulation of commercial use of biological resources.
      • Documentation and research.
      • Supporting biodiversity management committees.

    Jharkhand State Pollution Control Board

    • Formed after state creation.
    • Ensures compliance with:
      • Water Pollution Control Act (1974)
      • Air Pollution Control Act (1981)
      • Environment Protection Rules (1985)
      • Bio-medical Waste Rules (1998)
    • Issues No Objection Certificates (NOCs) to industrial units.
    • Monitors water quality in rivers and noise pollution in major cities like Ranchi, Dhanbad, Jamshedpur, and Hazaribagh.
    • Regional offices have been established for better monitoring.

    Jharkhand Climate Change Cell

    • Formed in collaboration with UNDP and the Jharkhand Government.
    • Purpose:
      • Provide knowledge on climate change.
      • Facilitate data analysis, policy support, and public awareness.
      • Guide all state departments on climate-resilient strategies.

    Jharkhand State Forest Development Corporation Ltd.

    • Established by the Government of Jharkhand in 2002.
    • Fully owned and operated by the state government.
    • Responsible for the maintenance of Nakshatra Van and Kanha Park in Ranchi.
    • Operates under the National Bamboo Mission.
    • Handles collection and marketing of kendu leaves.
    • Conducts auctions of forest products from various forest department depots.
    • Has three regional offices: Ranchi, Hazaribagh, and Deoghar.
    • Has six divisional offices: Ranchi, Jamshedpur, Hazaribagh, Giridih, Daltonganj, and Garhwa.

    Mineral Wealth of Jharkhand

    • Jharkhand holds about 46% of India’s total mineral reserves.
    • Major mineral contributions to India:
      • 29% Coal
      • 18% Copper
      • 30% Apatite
      • 105% Bauxite (indicative of overlapping categories or sources)
      • 29% Iron Ore
      • 95% Pyrite
    • Other minerals include:
      • Manganese, Chromium, Limestone, China Clay, Fire Clay, Silver, Dolomite, Uranium, Sulphur, etc.
    • Contributes:
      • 26% of India’s total mineral value output.
      • 36% of India’s total mineral production volume.
    • In 2013–14, total mineral production was valued at ₹20,685.41 crore.
    • Royalty earned: Approx. ₹645 crore.

    Types of Minerals

    Metallic Minerals

    • Includes: Iron, Manganese, Tungsten, Copper, Lead, Zinc, Bauxite, Gold, Silver, Tin, Barite, etc.

    Non-Metallic Minerals

    • Includes: Mica, Asbestos, Pyrite, Salt, Kyanite, Marble, Limestone, Building Stones, Glass Sand, etc.

    Atomic Energy Minerals

    • Includes: Uranium, Thorium, Ilmenite, Beryllium, Zircon, Antimony, Graphite, etc.

    Small-Scale and Cottage Industries

    Jharkhand’s rural economy is supported by a wide range of small and cottage industries categorized as follows:

    Traditional Rural Industries

    • Khadi
    • Rural crafts
    • Handloom
    • Handicrafts
    • Rope-making

    These are traditional and culturally rooted industries.

    Modern Small-Scale Industries

    • Small manufacturing units
    • Power loom industries

    These are urban-based and technology-driven, using electricity and modern tools.

    Key Cottage Industries in Jharkhand

    1. Agriculture-based Auxiliary Industries

    • Rice and pulse milling.
    • Oil pressing and jaggery production.
    • Making pickles, chutneys, and preserved fruits.
    • Tobacco and bidi (local cigarette) manufacturing.
    • Dairy, poultry, and beekeeping.
    • Fabric dyeing and tailoring.

    2. Textile Industry

    • Cotton ginning and spinning.
    • Thread and cloth weaving and printing.

    3. Woodwork

    • Timber cutting and processing.
    • Furniture making, toys, and tools.

    4. Metal Work

    • Refining raw metals.
    • Blacksmithing, knife, lock, and brass utensil production.

    5. Leather Industry

    • Leather processing and tanning.
    • Manufacturing shoes and other leather products.
    • Making fertilizers and buttons from bones.

    6. Pottery and Earthenware

    • Pottery-making, roof tiles, bricks, and lime preparation.

    7. Other Crafts

    • Lac crafting, bangle making, soap, paint, and varnish production.

    Sericulture (Silk Production)

    • Jharkhand is a leader in tasar silk production.
    • Major tasar-producing areas: Ranchi, Hazaribagh, Santhal Pargana, Palamu, Dhanbad.
    • Villages like Gengeya and Sawani (Godda district) also produce tasar cloth.
    • The Magaia Tasar Co-operative Society (98 members) produced 1,000 yards/month of tasar cloth.
    • A Tasar Research Centre operates near Ratu (Ranchi) to promote silk production.
    • Distribution of silk production in Jharkhand:
      • 40% Singhbhum
      • 25% Dumka
      • 13% Hazaribagh
    • 63% of India’s tasar silk comes from Jharkhand.

    Tobacco and Bidi Industry

    • Tobacco-based factories are spread across Jharkhand.
    • Key bidi manufacturing centers:
      • Pakur
      • Seraikela
      • Chaibasa
      • Jamshedpur
      • Chakradharpur
    • Employs 3,13,442 workers directly.
    • Additional 28,383 people work part-time.
    • Nationally, Andhra Pradesh (7.5 lakh) and Madhya Pradesh (6.25 lakh) lead in bidi employment.

    Wood Industry

    • Utilizes wood from Jharkhand’s forests.
    • Involves sawing, plywood production, and furniture manufacturing.
    • Singhbhum district has the highest number of sawmills (60+).
    • Sawmills cut wood into planks and logs.

    Lac Industry

    • Jharkhand is India’s top lac producer.
    • Lac is a resinous substance secreted by insects living on specific trees.
    • Trees hosting lac insects: Palash, Ber, Kusum.
    • Major lac production areas: Ranchi, Hazaribagh, Santhal Pargana, Koderma.
    • Key lac centers: Bundu, Garhwa, Murhu, Khunti, Pakur, Daltonganj, Chaibasa, Ranchi.
    • A Lac Research Centre was established in Namkum block of Ranchi.
    • Types of lac:
      • Kusumi Lac – From Kusum trees, produces high-quality lac.
      • Rangeen Lac – From Ber and Palash trees, deep red in color.

    Matchstick Industry

    • A forest-based small industry like silk and tobacco.
    • A matchstick unit is established in Koderma district.

    Read in hindi:-
    https://jharkhandexam.in/%e0%a4%9d%e0%a4%be%e0%a4%b0%e0%a4%96%e0%a4%82%e0%a4%a1-%e0%a4%95%e0%a5%80-%e0%a4%ad%e0%a5%8c%e0%a4%97%e0%a5%8b%e0%a4%b2%e0%a4%bf%e0%a4%95-%e0%a4%8f%e0%a4%b5%e0%a4%82-%e0%a4%86%e0%a4%b0%e0%a5%8d/