Tag: Jharkhand Employment Statistics

  • “Jharkhand Economy Explained: Minerals, Industries, Growth & Development”

    Explore the detailed economic profile of Jharkhand, highlighting its rich mineral resources, industrial hubs like Jamshedpur and Bokaro, growth trends, poverty statistics, and key budgetary insights—essential for competitive exams and policy analysis.

    Mineral Resources and Industrial Significance

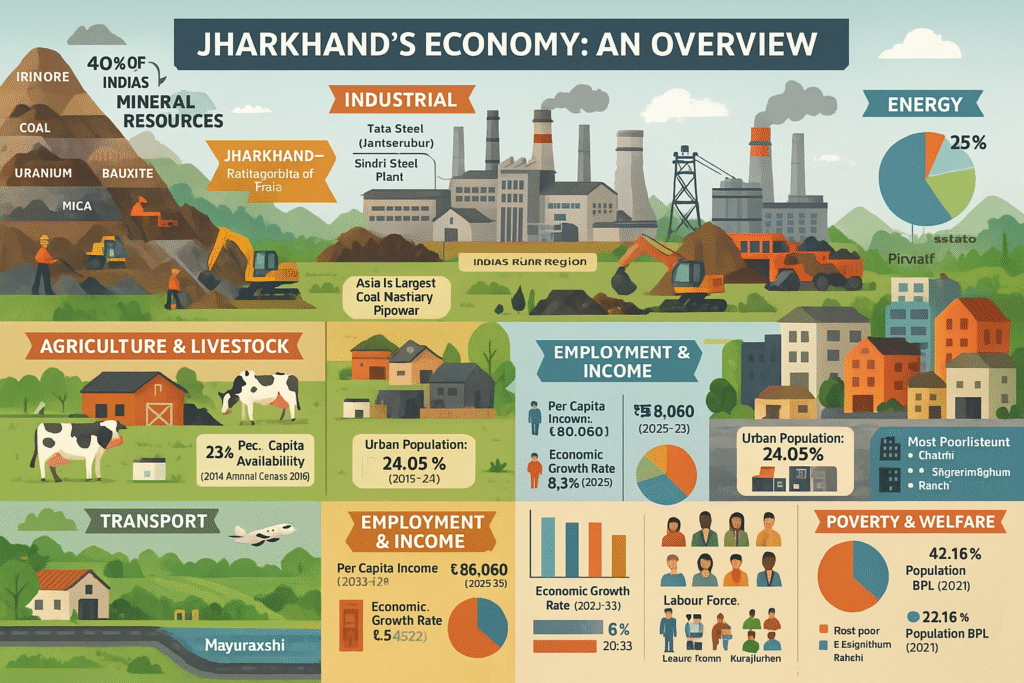
    • Jharkhand holds about 40% of India’s total mineral resources.
      ➤ Hence, it is referred to as “Ratnagarbha” or mineral-rich motherland.
    • Due to its mineral richness, Jharkhand is often compared with the Ruhr Region of Germany.
      ➤ The Rarika River (Koel) region earned it the title “Ruhr of India.”
    • According to the Indian Bureau of Mines, 58 types of minerals are found in Jharkhand.
    • The state’s economy is primarily based on mining and mineral-dependent industries.
    • Major industrial cities: Jamshedpur, Ranchi, Bokaro, Dhanbad.

    Firsts in Indian Industrial History (Exam Relevant Facts)

    • First Fertilizer Plant: Sindri (Dhanbad)
    • First Iron & Steel Plant: Jamshedpur
    • Asia’s Largest Coal Washery: Piparwar (Chatra)
    • First Coal Washery in India: Ghatotand (Ramgarh)
    • First Methane Gas Project: Parbatpur (Bokaro)
    • In 1779, the first modern effort to produce iron-steel was made in Jharia, Dhanbad.

    Economic Contribution by Sector (2022-23)

    • As per Economic Survey 2022-23, the Secondary Sector contributes 33.6% to GSVA.
    • Major mineral-based industries:
      • Tata Steel (formerly TISCO)
      • Tata Motors (formerly TELCO)
      • Sindri Fertilizers
      • Heavy Engineering Corporation (HEC)
    • Abundant minerals:
      • Iron ore, Manganese, Coal, Dolomite – supporting the steel industry.
      • Copper, Sulfur, Asbestos, Bauxite, Mica, Uranium – enabling the development of copper, power, and aluminum industries.

    Transport and Connectivity

    • Jharkhand has developed road, rail, and air transport networks.
    • Inland water transport has not developed well due to the hilly terrain of rivers.
    • Mayurakshi River is the only river suitable for transport during monsoons.

    Forest-Based Industries

    • Rich forests support industries like:
      • Timber industry
      • Paper and pulp industry
      • Lac industry

    Energy Resources

    • Major energy sources:
      • Coal and Hydro
      • Other renewable sources are negligible.
    • Installed electricity capacity: 2,735 MW
      Ownership Distribution:
      • 55% – Central Government
      • 20% – State Government
      • 25% – Private sector

    Animal Husbandry & Dairy

    • As per 20th Livestock Census 2019, total livestock: 23.6 million
    • Per capita milk availability (2019–20): 182 grams/day

    Design & Industrial Parks (Upcoming Projects)

    • Design Institute in Ranchi with support from NID Ahmedabad (Proposed)
    • Silk Parks to be set up in Ranchi and Kharsawan (Proposed)
    • Plastic Park established in Deoghar
    • Police Training Center in Hazaribagh to be upgraded to a Police Academy
    • Investigation Training School to be established in Ranchi

    Growth and Per Capita Income (2020–23)

    • Economic Growth Rate:
      • 2020-21: 5.6%
      • 2021-22: 7.6%
      • 2022-23: 8.5% (Estimated)
    • Per Capita Income (2022–23): ₹86,060
      Jharkhand ranks 26th in India post-J&K reorganization.

    Special Initiatives and Banking

    • First Child Budget introduced in Budget 2019–20
    • First Fish Credit Card launched by Jharkhand State Cooperative Bank
    • Lead Bank Scheme in Jharkhand:
      • SBI: 7 districts
      • Indian Bank: 2 districts
      • Bank of India: 15 districts

    Labor Participation and Unemployment (2022–23)

    CategoryLabor Force Participation (%)Unemployment Rate (%)
    Total65.13.4
    Rural69.42.0
    Urban50.19.8
    Male82.94.8
    Female47.00.8

    Poverty: Global Multidimensional Poverty Index (2021)

    • 42.16% of the population is poor (second-highest after Bihar – 51.91%)
    • In 2005-06, the poverty level was 74.9%, showing a major decline.
    • Between 2005-06 and 2015-16, Jharkhand recorded the highest poverty reduction (72 lakh people) in India.
    • MPI Score (2021):
      • Overall: 0.202
      • Rural: 0.246
      • Urban: 0.067
    • Poorest Districts:
      • Chatra (60.74%)
      • Pakur (60.66%)
      • West Singhbhum (57.60%)
      • Sahibganj (55.93%)
      • Garhwa (53.26%)
    • Least Poor Districts:
      • East Singhbhum (23.99%)
      • Ranchi (27.7%)

    Urban Development (Census 2011)

    • Urban Population: 24.05% (below national average of 32%)
    • Total Cities/Towns: 228
      ➤ Classification:
      • Million-plus cities: 3
      • Class I (1–10 lakh): 7
      • Class II (50k–1 lakh): 12
      • Class III (20k–50k): 39
      • Class IV (10k–20k): 48
      • Class V (5k–10k): 90
      • Class VI (Below 5k): 29
    • Total Slum Population: 3,72,999
      ➤ Highest in Class I cities, lowest in Class V cities
    • Slum Literacy Rate: 65%
    • Working Population in Slums: 68%

    Budget 2023–24 (Key Highlights)

    ParameterAmount (₹ Crore)
    Revenue Receipts98,337.15
    Capital Receipts18,080.85
    Total Receipts1,16,418.00
    Revenue Expenditure84,676.00
    Capital Expenditure31,742.00
    Fiscal Deficit₹11,674.57 (2.76%)
    Primary Deficit₹4,887.48 (1.15%)
    Revenue Deficit₹13,661.15 (-3.40%)
    Effective Revenue Deficit₹20,764.19 (-4.91%)

    Growth Targets in 11th & 12th Five-Year Plans

    Sector11th Plan Target11th Achieved12th Plan Target
    Primary Sector6.3%7.8%6.5%
    Secondary Sector12.0%12.6%12.5%
    Tertiary Sector8.0%10.2%17.5%
    Overall GSDP Growth9.8%7.2%10.0%

    Sector-wise GSVA Contribution & Growth Rate

    SectorGrowth RateGSVA Contribution
    Primary Sector8.8%21.8%
    Secondary Sector7.0%33.6%
    Tertiary Sector7.5%44.6%